
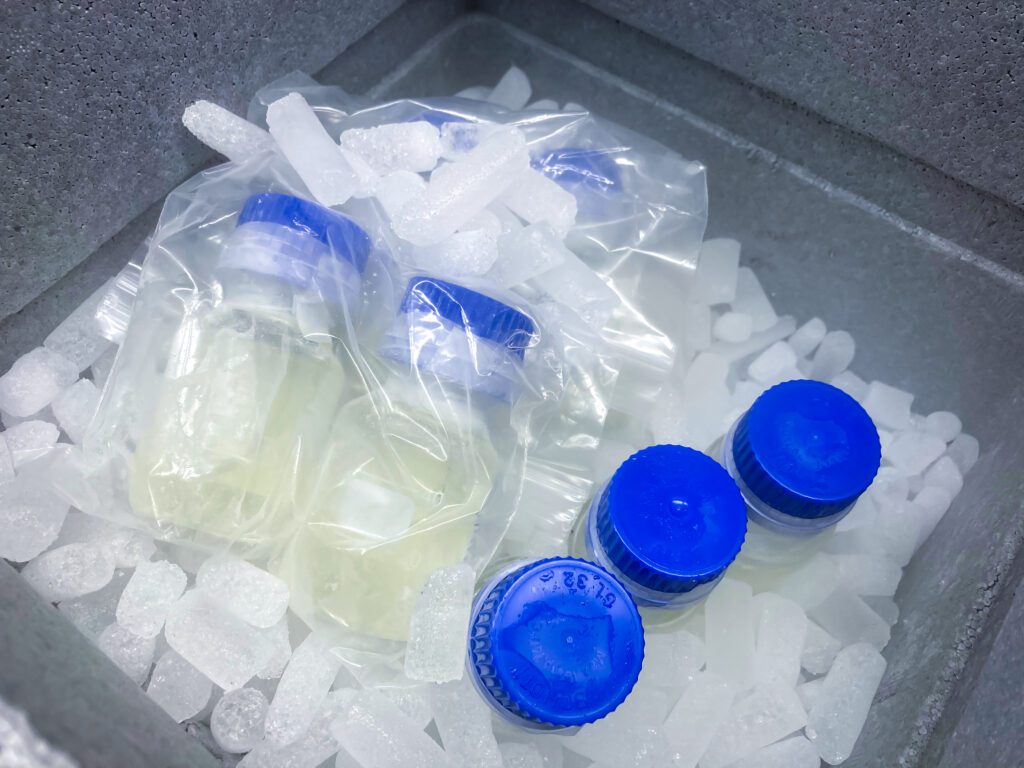
A biologic shipment arrives at your distribution center. Box integrity looks acceptable. Inside, a temperature data logger has recorded the entire journey, but the receiving team can’t access that temperature history without opening the box and downloading the information from the device.
Two technologies, two operational purposes
Temperature indicators and data loggers answer different questions at different moments in your cold chain.
QR-enabled single-use temperature indicators provide immediate verification when you open the package. Scan the QR code with a standard smartphone for instant confirmation of whether temperature limits were exceeded during transit.
Data loggers record continuous temperature data throughout the journey, capturing the full temperature profile with time-stamped data points. The data logger stores a complete temperature history, but you must retrieve the device and download the data before you can review it.
Neither technology replaces the other. Each serves specific operational needs. Match the tool to the decision moment and regulatory requirement at each supply chain stage.
Where immediate verification supports receiving decisions
Receiving decisions happen in real time, not after data download.
When shipments arrive, operations teams need to know immediately: inventory or quarantine? Data loggers provide that answer through temperature history, but not until you open the package, retrieve the device, connect to a computer, and download the data.
QR-enabled indicators deliver go/no-go information when you open the package. No device retrieval or download required. Operations staff scan the code with a standard smartphone and see whether temperature limits were exceeded.
Immediate verification supports operations in:
- High-volume facilities processing hundreds of shipments daily without a device management infrastructure
- Last-mile delivery sites, distributed clinics, and smaller facilities without dedicated monitoring equipment or specialized training
- Commercial distribution of biologics and vaccines, where validated packaging provides thermal protection, and receiving teams need fast throughput
QR indicators complement validated packaging and existing data logger systems. They support the decision moment between package arrival and detailed data analysis. They can also provide temperature confirmation where validated packaging or data logger systems are not in use.
When detailed temperature profiles are required
Some shipments require more than go/no-go verification.
Validation studies require continuous temperature curves demonstrating packaging performance across expected and extreme conditions. Investigational product shipments in clinical trials often mandate continuous monitoring as part of the protocol. When excursions occur, investigations require specifics: exact temperature, duration, timing during the journey. Regulatory agencies reviewing applications expect full temperature documentation for stability claims.
Data loggers provide documentation for these scenarios. They record temperature continuously throughout transit, store data securely with time-stamped data points, and generate reports supporting regulatory submissions and deviation investigations. The device remains inside the shipping container from origin to destination, capturing temperature data throughout the journey.
After delivery, retrieve the data logger from the package, download the complete temperature profile, and integrate data into batch records and quality documentation.
Operational differences that affect selection
Differences between technologies show up in daily operations, not just technical specifications.
Training requirements: QR indicators require basic instruction: scan the code, read the result. Data loggers require device management training, software familiarity, and the skill (or training) to interpret temperature curves.
Infrastructure requirements: Single-use QR indicators require no retrieval, no calibration cycles, and no device inventory management. Use once and document the result. In addition, the QR provides an undisputable digital go/no-go outcome for the recipient that is also logged in the SpotSee cloud, for the shipper to view. No downloads or extra layers of back-and-forth communication to confirm what happened at receipt. Data loggers require infrastructure for data download, device retrieval, and return logistics, calibration management, and software systems to store and analyze data.
Cost structure: Single-use indicators carry a per-unit cost with no additional operational overhead. Data loggers require capital investment in reusable devices, showing lower per-shipment costs at high volume but ongoing expenses for device management and calibration.
Decision timing: Indicators deliver confirmation when you open the package at receiving. Data loggers provide detailed analysis after retrieval and download, showing what occurred throughout the journey.
The appropriate choice depends on operational context, shipment volume, regulatory requirements, and where in the supply chain you need actionable information.
Application across cold chain scenarios
Different products and supply chain stages call for different monitoring approaches.
Life sciences context: Cell and gene therapies in investigational phases typically require data loggers for full shipment monitoring. This provides the complete temperature history needed for regulatory documentation and protocol compliance. Commercial distribution of established cell therapies may use QR indicators for verification at receiving without specialized equipment at treatment centers.
Pharmaceutical context: Oncology biologics and specialty pharmaceutical products benefit from layered approaches. Data loggers support high-value/high-volume shipments, validation studies, and routes with known temperature challenges. QR indicators support routine commercial distribution where validated packaging provides thermal protection. Risk assessment drives the decision: product value, route complexity, seasonal conditions, and recipient site capabilities.
Diagnostics context: Test kits and reagents shipped to clinical labs and research sites often arrive at locations without sophisticated receiving infrastructure. QR indicators provide verification without device management expertise or specialized equipment. Labs scan the code during unpacking, confirm temperature status, and document in receiving records.
Cold chain logistics context: Multi-modal shipments with multiple hand-offs create decision points throughout the journey. QR indicators at transfer points provide confirmation as custody changes when packages are opened. Data loggers provide end-to-end documentation from manufacturer to final destination, showing temperature history and supporting excursion investigations.
(All examples are hypothetical for illustration purposes.)
Total cost beyond device price
Device price represents one component of total monitoring cost.
Single-use indicators eliminate operational overhead. No retrieval logistics, no calibration management, no device inventory tracking. Cost per monitored shipment includes device price plus documentation labor.
Data loggers show lower per-unit costs at scale, but require operational infrastructure. Total cost includes device purchase or lease, calibration and maintenance, and, depending on your program, software and data-management overhead (for example, if your internal processes require additional systems for storage, review workflows, or integration into existing quality documentation). It also includes labor for device retrieval and data download, and reverse logistics to return devices from receiving sites. Cost per monitored shipment includes all elements.
Volume affects the calculation. Thousands of packages monthly through centralized distribution may favor reusable data loggers. Smaller volumes to distributed sites may benefit from single-use indicators. Shipment frequency matters: continuous high-volume operations distribute infrastructure costs across more shipments, intermittent or seasonal volume concentrates those costs.
Sites with limited technical capabilities or high staff turnover face higher training and support costs for device management. Simple verification reduces that requirement.
Calculate your break-even point based on your specific operation.
Compliance perspective on technology selection
Neither FDA nor EU regulations mandate specific monitoring technology.
Requirements focus on outcomes: maintain product within specified temperature limits, document compliance, and investigate deviations. Your quality agreement and risk assessment define minimum monitoring requirements for each product and route. The monitoring technology you select must support those commitments.
Both QR indicators and data loggers meet compliance requirements when properly implemented and documented in Standard Operating Procedures (SOPs).
Validation studies and regulatory submissions typically require continuous temperature data from data loggers. The detailed temperature profile supports stability claims and demonstrates packaging performance. Commercial distribution monitoring should align with validated packaging performance, shipping lane risk assessment, and quality agreement commitments.
Documentation must align with validation protocols and SOP commitments regardless of technology. Record monitoring results, investigate excursions with appropriate detail, and maintain traceability to specific shipment and batch.
Update SOPs to reflect which monitoring technology applies to which product and shipping scenario. Train receiving personnel on proper documentation for each approach. Ensure your quality management system captures and retains required records.
Regulatory compliance comes from consistent execution of documented procedures.
Decision framework for technology selection
Selecting appropriate monitoring technology starts with clarity about operational requirements.
Follow this framework:
- Identify where immediate decisions versus detailed documentation is required. Where do you need confirmation when opening packages? Where do you need continuous temperature profiles showing what occurred throughout transit? Match technology to the decision moment.
- Review total cost of ownership for your specific operation. Include all infrastructure, labor, and logistics costs beyond device price. Calculate break-even volume for reusable versus single-use approaches in your context.
- Request samples for controlled testing in your receiving environment. Evaluate how each technology integrates with current workflows. Assess training requirements. Measure time from package arrival to monitoring verification.
- Consult your quality team to align technology selection with regulatory commitments. Verify monitoring approaches meet requirements in quality agreements, validation protocols, and SOPs.
- Consider supply chain complexity. Centralized distribution through controlled facilities may favor reusable data loggers. Distributed networks serving multiple small sites may benefit from single-use verification.
- Start with a focused pilot. Test both approaches on representative shipping lanes before organization-wide changes. Gather operational feedback. Refine procedures based on results.
The appropriate monitoring technology supports operational decisions while meeting compliance requirements. The best choice depends on your specific products, supply chain structure, and operational capabilities.
Conclusion
The question isn’t which technology is superior. It’s which technology fits your operational moment.
Operations benefit from matching QR indicators to high-volume commercial distribution while maintaining data loggers for investigational shipments and validation studies. The combination supports faster throughput where speed matters and detailed documentation where regulations require it.
Your next step: Request samples of both QR-enabled indicators and data loggers. Test them in your actual receiving environment on representative shipping lanes. Measure the operational differences before making supply chain decisions.
—
You might also like:


