
The physical reality behind digital infrastructure
A server rack arrives at a hyperscale facility after a cross-country shipment. It passes a visual inspection, gets installed, and three weeks later an unexpected storage failure surfaces. The investigation leads back to a shock event that happened somewhere between the loading dock and the freight carrier’s hub. Nobody recorded it. The cost of that missed moment is measured in downtime, data risk, and a disputed insurance claim.
Condition monitoring for data centers exists to close exactly that gap.
The growth of AI workloads has pushed server density and per-rack asset values to levels where a single undetected handling incident can cascade into significant operational consequences. Visual inspection at receipt does not capture what happened during transit. And once a server is installed, localized heat buildup, airflow imbalance, or rack-level temperature variation can develop quietly before they trigger a system alert.
This article maps a practical framework across three stages: transportation, installation and commissioning, and live operations.
Condition monitoring across the data center lifecycle
Risk accumulates from the point of manufacture through every handling event, every mile of freight, every rack installation, and every day of operation. A condition record that starts only at power-on is missing the part of the story most likely to explain early failures.
Three stages define the framework:
- Transportation — from origin to receiving dock
- Installation and commissioning — from unboxing through rack deployment
- Operations — ongoing thermal visibility at the rack level
Each stage connects to the next. The condition record is only useful if it is continuous.
Transportation monitoring: protecting equipment before it arrives
High-value server hardware travels through freight environments that introduce shock, vibration, temperature variation, and handling uncertainty. A shipment can experience multiple impact events and arrive with no external evidence of any of them. The packaging is intact. The visual check passes. The equipment goes to the rack. And the condition data that would have informed a better decision at receipt simply does not exist.
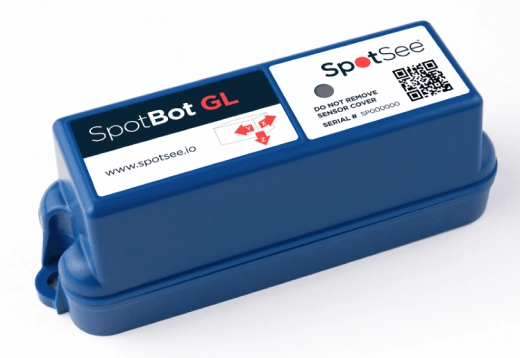
SpotBot GL is a connected condition monitor designed for this stage. It tracks shock events, temperature conditions, shipment location, time of incidents, and handling history throughout transit. Data transmits in real time to the SpotSee Cloud, giving operations and logistics teams visibility before the shipment arrives, not after it has already been installed.
SpotBot GL captures:
- Shock events, including magnitude, direction, and timing
- Temperature and humidity conditions throughout the journey
- Location and geofencing alerts for arrival confirmation
- A complete handling history available for forensic review on arrival
That condition record supports claims and carrier accountability, informs pre-installation decisions when a significant event is detected, and builds a dataset for shipping lane optimization over time.
Installation assurance: monitoring server condition after deployment
Transportation monitoring captures what happened in transit. But the period between arrival and full rack deployment introduces its own handling risks. Servers move from receiving to staging areas, get lifted into racks, and are connected by teams working under time pressure. Each of those handling moments is an opportunity for an impact event.
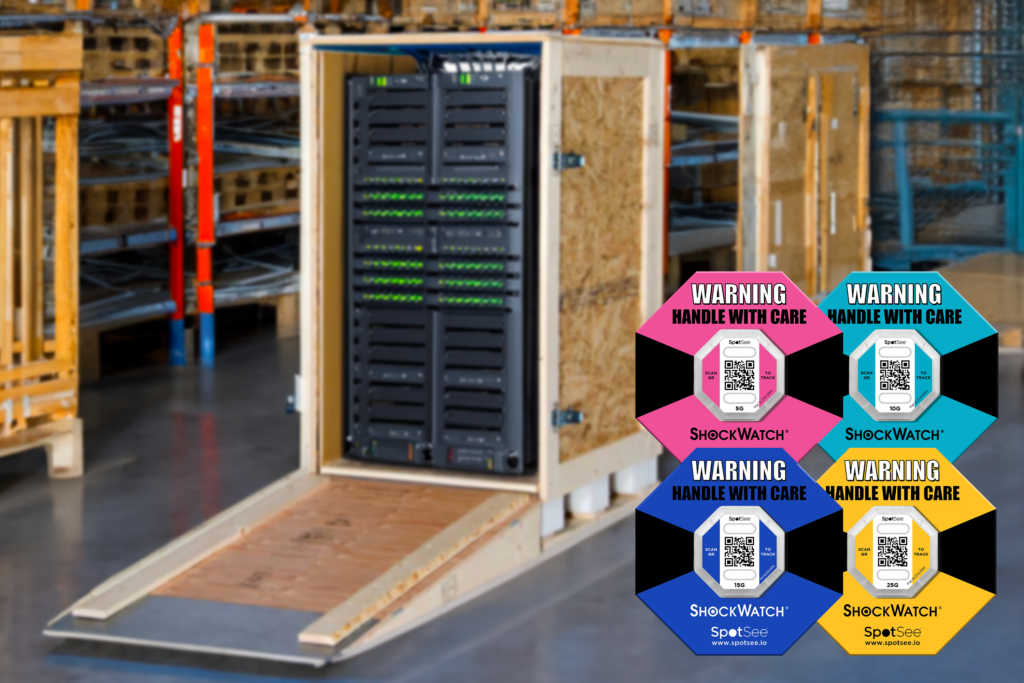
ShockWatch® 2 QR is a compact, field-armable impact indicator that provides immediate visual indication when an item has been exposed to an impact exceeding its set threshold. The indicator permanently turns from clear to red when that threshold is crossed, giving the installation team an unambiguous signal at any point during deployment.
Scanning the QR code with a smartphone, no app required, records the serial number, condition status, and location at the time of the scan. That data goes to the SpotSee Cloud and becomes part of the installation condition record.
In practice, this means:
- Immediate visual indication — a red indicator is the signal to pause and inspect before the equipment goes live
- Digital scan records — each scan creates a timestamped, location-tagged entry that supports root-cause analysis if a failure surfaces later
- Faster acceptance inspections — no paper logs, no reconstructed timelines; the condition record is attached to each unit
ShockWatch 2 QR is available in multiple G-force threshold options and operates from -25°C to 80°C, covering the range of environments encountered during data center receiving and installation.
Thermal visibility during operations
Once servers are installed and running, thermal management becomes the primary environmental concern. Cooling performance is not uniform across a rack, and thermal anomalies can develop at specific points, such as rack inlet zones and high-density blade configurations, without triggering a system-level alert.
Liquid crystal thermometers provide a direct, non-electronic way to monitor surface temperature at specific rack points. They use thermochromic liquid crystal technology to display current surface temperature through a color change readable at a glance. No power source or software integration is needed.
For data center operations, this supports rack inlet temperature verification during walkthroughs, surface monitoring on components that run warmer than the rack average, thermal checks during commissioning before a full thermal survey is complete, and cooling optimization when validating airflow adjustments.
Creating a continuous condition record
The three tools are most valuable as a connected sequence, not independent products.
| Stage | Monitor | What it captures |
| Transportation | SpotBot GL | Shock events, temperature, location, handling history |
| Installation | ShockWatch® 2 QR | Impact events during deployment, digital scan records |
| Operations | Liquid crystal thermometers | Surface temperature, rack inlet verification, thermal anomalies |
SpotBot GL data informs the receiving inspection. ShockWatch® 2 QR records carry forward into the installation history. Liquid crystal thermometer readings become part of the ongoing operational baseline. Each stage builds on the last, creating a condition record that spans the full equipment lifecycle, from shipment through live operation.
That record is the foundation for faster root-cause analysis, stronger accountability across the supply chain, and more confident decisions for data center operators, server OEMs, logistics providers, and procurement teams alike.
Conclusion
Reliable data center infrastructure starts long before a server is powered on. The physical journey from manufacturer to rack involves handling events and environmental exposures that carry real risk, and most of that risk is invisible without instrumented monitoring.
A condition monitoring framework using SpotBot GL , ShockWatch® 2 QR, and liquid crystal thermometers in sequence makes that risk visible and traceable at every stage. It reduces the uncertainty that makes failures expensive and investigations inconclusive.
The condition record is the asset. Building it from shipment to rack is the practice.
Frequently asked questions
What is condition monitoring for data center infrastructure?
Condition monitoring for data centers uses physical indicators and connected devices to track the handling, impact, and thermal history of server hardware throughout its lifecycle, covering transportation, installation, and live operations. The goal is a continuous condition record that supports faster root-cause analysis and stronger accountability at every stage.
Why isn’t a visual inspection at receiving enough?
Visual inspection checks for obvious physical damage to packaging. It does not capture impact events that occurred during transit without leaving external marks, temperature excursions that affected internal components, or the sequence and timing of handling events. SpotBot GL provides the event history a visual check cannot.
How does ShockWatch® 2 QR work during server installation?
ShockWatch® 2 QR can be applied before transport, at receiving, or during installation to support safe handling through each transition point. The indicator permanently turns red if an impact exceeds its set G-force threshold. Scanning the QR code with a smartphone records serial number, condition status, and location at the time of the scan, without an app, and sends that data to the SpotSee Cloud.
Can liquid crystal thermometers replace electronic temperature monitoring in a data center?
No. Liquid crystal thermometers provide surface/ambient temperature indication at specific rack points and complement electronic monitoring systems. They do not replace data loggers or integrated thermal management systems.
What happens if SpotBot GL records a significant shock event during transit?
The receiving team can flag the equipment for a more thorough inspection before it moves to installation. Having the event data, including magnitude, direction, and timing, allows an informed decision about whether to proceed, escalate to the OEM, or file a carrier claim, based on evidence rather than assumption.
How do these three monitoring tools work together?
SpotBot GL captures the transit condition record. ShockWatch® 2 QR extends that record through the installation period. Liquid crystal thermometers provide ongoing thermal visibility in operation. Together they create a continuous condition record from shipment through live operation.
—-
You might also like:


