
Thermal mapping does not usually fail because the data loggers missed something. It fails because the results never change what teams monitor every day or how they respond when a reading is good or bad.
A mapping study can produce a clean report, detailed graphs, and audit-ready documentation while daily operations continue using the same convenient sensor location near the door. In that situation, the map exists on paper, but the operational risk has not changed.
Thermal mapping becomes operationally useful when it changes three things:
- Where you monitor
- Which locations drive decisions
- What actions follow an out-of-range reading
What thermal mapping is actually supposed to do
Thermal mapping helps teams understand how temperature varies across a space over time.
Routine monitoring is different. It focuses on a smaller number of selected locations used for day-to-day operational control.
That distinction matters because mapping is not the control itself. Mapping helps identify where control should happen.
It is also important to stay precise about what the devices measure.
Data loggers measure ambient air temperature at the sensor location. They do not directly measure internal product temperature.
That does not reduce their value. It simply means placement matters.
Why mapping studies often fail operationally
A common pattern looks like this:
- A mapping study identifies warm-risk areas
- The report is approved and archived
- Daily monitoring continues in the same easy-to-access locations
Nothing changes at receiving, staging, or internal hand-offs.
In practice, this means the organization paid for visibility but never translated that visibility into operational control.
If a mapping study does not change routine monitoring placement or response workflows, the study is incomplete.
Start with decision points, not sensor placement
Before placing a single logger, define where temperature readings actually change what happens next.
These are operational decision points, including:
- Receiving staging areas before put-away
- Temporary holding zones during unloading
- Internal transfers between storage areas
- Picking and packing staging locations
- Areas with repeated door openings or high traffic
At these locations, the reading should support a clear operational decision.
For example:
- In range → Accept and move product forward
- Out of range or uncertain → Hold, inspect, and escalate if required
This is where thermal mapping becomes useful. The map helps determine which locations deserve ongoing monitoring because they influence real decisions.
Build the mapping study around operational reality
A practical mapping study starts with understanding how the space is actually used.
That includes:
- Door traffic patterns
- Shift timing
- Loading schedules
- Defrost cycles
- Congested staging areas
- Airflow disruptions from operational activity
The goal is not to create a perfect engineering model. The goal is to identify where operational risk actually appears.
Place loggers to find variability, not convenience
Logger placement should reflect the room as a three-dimensional environment.
That means covering:
- Footprint locations, including doors, corners, center zones, and back walls
- Vertical locations, including low, middle, and high positions
- Risk zones, such as evaporator discharge areas, return air paths, and staging locations
A simple labeling plan helps maintain consistency:
- Location ID
- Height
- Basic room sketch
- Intended risk type
The important point is that placement should expose variability, not avoid it.
Run the study long enough to capture normal behavior
A useful mapping study captures real operating conditions, not just ideal conditions.
That usually means allowing enough time to observe:
- Door opening cycles
- Heavy traffic periods
- Defrost events
- Restocking patterns
- Weekend or overnight conditions
Context matters as much as the raw data.
If unusual events occur during the study, document them clearly so the results can be interpreted correctly later.
Turn the map into daily monitoring locations
This is the step many organizations skip.
Once variability is identified, select a smaller set of routine monitoring points that support ongoing control.
In practice, this often includes:
Representative point
A location used to reflect overall room stability.
Warm-risk point
The area most likely to drift outside the acceptable range due to traffic, airflow, or operational behavior.
Decision-point location
A monitoring point tied directly to receiving, staging, or internal hand-offs.
The point of mapping is not to monitor everywhere forever. It is to identify the locations that matter operationally.
Create a simple “good read vs. bad read” workflow
Daily monitoring only works when the response is clear.
A practical workflow should remain operational and easy to execute under time pressure.
Example:
| Decision point | Good read action | Bad read action |
| Receiving staging | Record and move product forward | Hold product, inspect door activity and staging duration, escalate if repeated |
| Internal transfer staging | Continue movement to storage | Pause transfer and inspect airflow or operational delays |
The key is consistency.
The reading itself is not the outcome. The response workflow is.
Choosing data loggers for mapping and routine monitoring
Different workflows require different logger approaches. The goal is to match the device to the operational decision, not just the recording capability.
For broad thermal mapping deployments
SpotSee MaxiLog PDF devices work well for large mapping studies where teams need fast deployment across multiple locations with minimal setup complexity.
Operational advantages include:
- Direct PDF and CSV outputs
- USB download
- No special software required
- 90-day recording duration
- Temperature range from -30°C to +70°C
Because the report is generated directly from the device, this approach supports distributed storage environments where teams need simple documentation workflows and quick retrieval during audits or investigations.
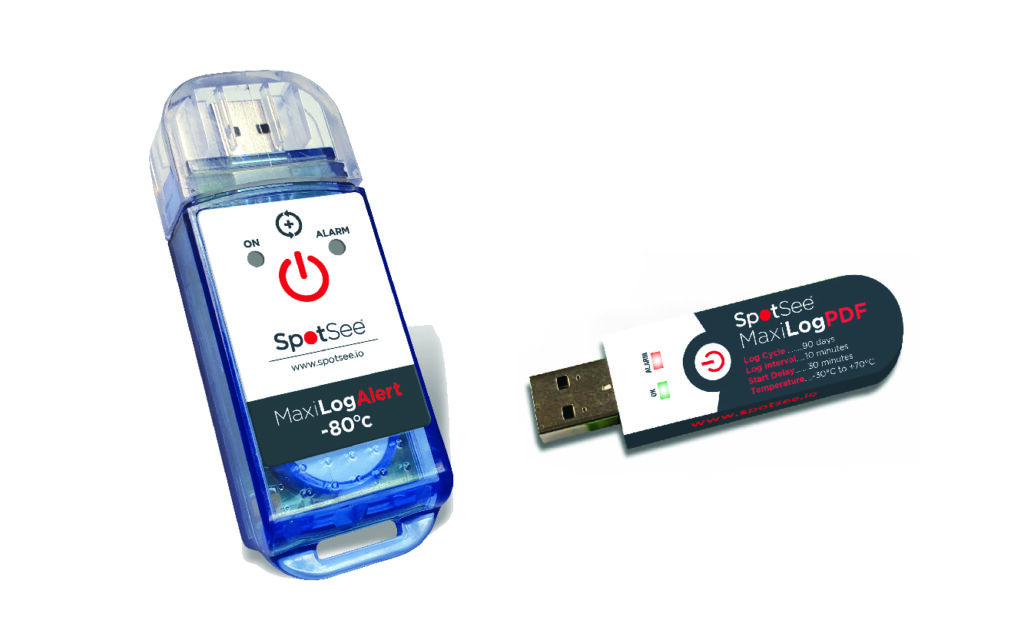
For recurring storage monitoring programs
The SpotSee MaxiLog Alert family is designed for repeat monitoring workflows and ongoing operational review.
Options include:
- Single-use and multi-use models
- Standard refrigerated monitoring ranges
- Dedicated ultra-low temperature models for -80°C environments
- Compatibility with QA review and controlled documentation workflows
This type of logger fits operations where quality and facilities teams routinely review monitoring data as part of storage management and escalation processes.
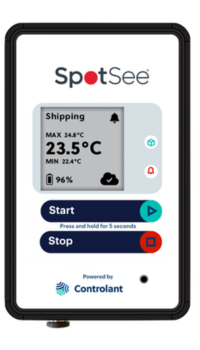
For downloadable trip history and remote visibility
SpotSee GO supports workflows where teams need remote visibility into temperature conditions during storage or transit without waiting for the shipment to arrive before accessing the data.
Because it combines data logging with cellular connectivity, SpotSee GO can support both ongoing monitoring and in-transit visibility for operations that need faster awareness of temperature conditions across distributed sites or moving shipments.
This type of monitoring is especially useful when teams need to:
- Review temperature conditions remotely
- Monitor shipments during transit
- Investigate storage or staging concerns without physically retrieving the logger
- Support escalation workflows while the shipment is still moving
In practice, remote-access logger records can help support:
- Deviation review
- Investigation workflows
- Packaging improvement initiatives
- Supplier or carrier discussions
- Visibility across distributed operations and transit lanes
The important point is not the amount of data collected. It is whether the logger output supports a clear operational response.
SpotSee data loggers support different monitoring depths, from broad thermal mapping studies to ongoing QA review workflows and remote visibility during storage and transit.
A practical receiving example
Imagine refrigerated ingredients staged temporarily near receiving while paperwork and storage space are being coordinated.
A mapping study reveals that this staging zone consistently runs warmer than the deeper storage location where the original monitoring sensor was placed.
Because staging is a real operational decision point, the daily monitoring logger is moved to that staging area.
Now the workflow changes:
- In-range reading → Move product into storage
- Out-of-range reading → Hold product, inspect staging duration and door activity, document the event, and escalate if the trend repeats
The mapping study has now changed operational behavior, not just documentation.
Common misconceptions
“We already have a sensor in the room”
One sensor may not represent the highest-risk location identified during mapping.
The purpose of mapping is to identify which locations actually influence operational risk.
“Not every excursion requires action”
Correct. That is why thresholds and escalation paths should be defined before routine monitoring begins.
The goal is a proportional, repeatable response, not constant escalation.
“Mapping is mainly for audits”
It does support audits, but its highest operational value comes from improving daily monitoring placement and hand-off decisions.
What successful thermal mapping looks like
Thermal mapping works best when it changes the daily workflow.
A successful study leads to:
- Better monitoring placement
- Clearer operational decision points
- Consistent response actions
- Stronger documentation during receiving and staging
At that point, the data logger is no longer just collecting data. It is supporting operational control.
Review your last mapping report and ask one practical question:
Which daily monitoring locations changed because of the study?
If the answer is “none,” start with a single operational decision point, such as receiving staging, and map specifically to improve that workflow.
Great data without a clear operational response is still just a documented delay.
–
You might also like:


