

When a shipment arrives, how much information do you actually need to make the next decision?
Sometimes the answer is a complete history. You need to understand what happened throughout transit, when conditions changed and potentially where an exception occurred.
But sometimes the question is much simpler.
Did this shipment experience a condition outside the acceptable threshold?
If that is the decision your receiving team needs to make, collecting a complete journey history may be more information than the workflow requires.
That distinction is where QR-enabled condition indicators can fit between a traditional visual indicator and a data logger.
Start with the question, not the technology
It is easy to assume that more shipment data automatically means better shipment monitoring.
In practice, the useful amount of data depends on what the team needs to do with it.
A data logger records measurements at intervals throughout a journey, creating a detailed history that can be reviewed after or, depending on the technology, during transit. SpotSee’s data logger solutions are designed for applications where teams need that level of temperature history.
A QR-enabled indicator serves a different purpose. It monitors for a defined condition and provides an immediate visual indication when that condition has been met. Scanning the QR code with a smartphone can then create a digital record associated with that indicator.
Instead of asking “How much data can we collect?” a more useful starting point is:
What information will change the decision we make when this shipment arrives?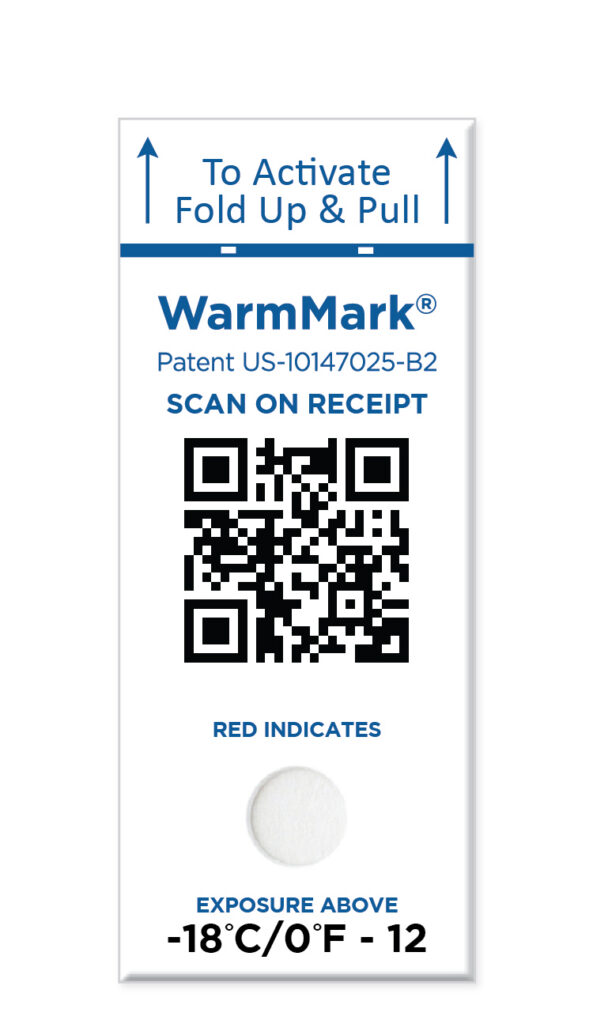
If the question is “did it get too warm or too cold?”
Temperature-sensitive shipments provide a good example of why the distinction matters.
A pharmaceutical manufacturer shipping a high-value biologic through a complex international cold chain may require a detailed temperature history. A different operation may primarily need to confirm at receipt whether a package crossed a defined temperature threshold.
For exposure above an acceptable temperature, WarmMark QR is a single-use, battery-free time-temperature indicator. It monitors cumulative exposure above a specified threshold and irreversibly changes color when the defined time-temperature condition is met.
When scanned with a smartphone, the scan can capture information including the indicator condition, time, date, location and serial number in the SpotSee Cloud. No dedicated app or battery is required.
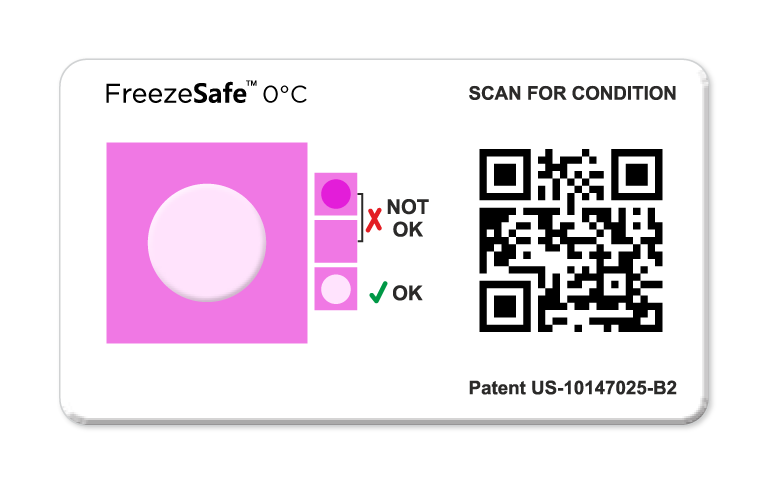
For exposure below an acceptable threshold, FreezeSafe QR applies the same general idea to damaging cold conditions. The indicator provides irreversible visual evidence of exposure below its defined threshold, while a smartphone scan creates a digital record associated with the shipment.
Together, the two products address opposite temperature risks: WarmMark QR for ascending temperature exposure and FreezeSafe QR for descending temperature exposure.
The important distinction is that neither is trying to recreate a complete temperature profile. The indicator answers the threshold question while the QR functionality documents what was observed and where and when it was scanned.
The same principle applies beyond temperature
The “how much data do we need?” question is not limited to cold chain logistics.
Consider a piece of sensitive industrial equipment arriving at a receiving dock.
The team may not need a complete record of every movement during a three-day journey. They may need to know whether the shipment experienced an impact significant enough to trigger an inspection before installation.
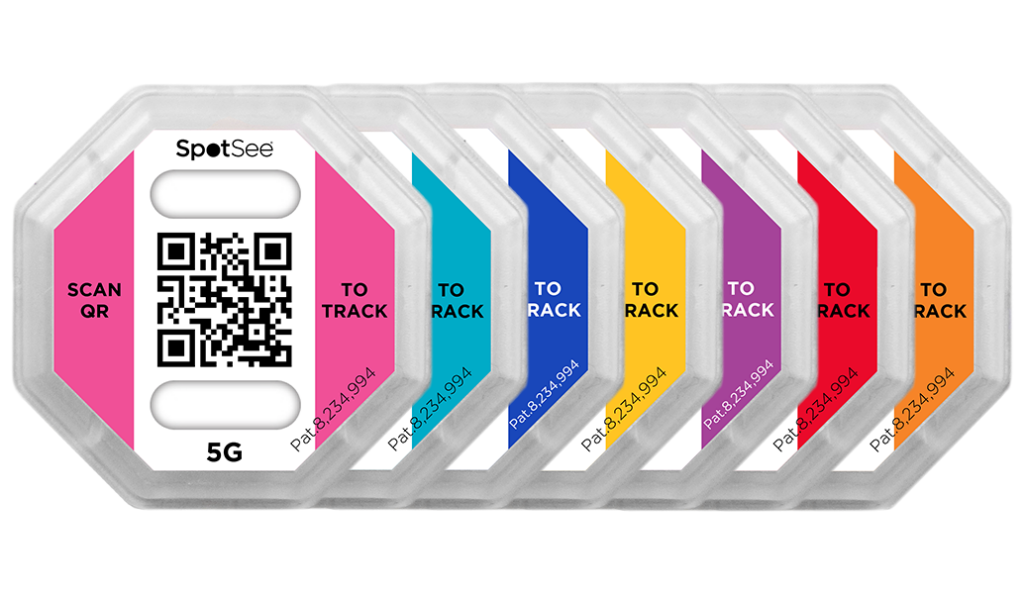
ShockWatch 2 QR is a single-use, battery-free impact indicator designed for that type of decision. If an impact exceeds the selected threshold, the indicator provides a permanent visual alert. A smartphone scan records the condition and associated scan information in the SpotSee Cloud.
For equipment that must remain upright, the relevant question changes again.
Was it tipped beyond the acceptable angle?
TiltWatch XTR QR turns red if a shipment tips beyond 80 degrees. Scanning the indicator captures its condition along with time, location and serial number, creating a digital record at the point of inspection.
In both cases, the value comes from connecting a simple physical exception signal with documentation at a meaningful point in the shipment journey.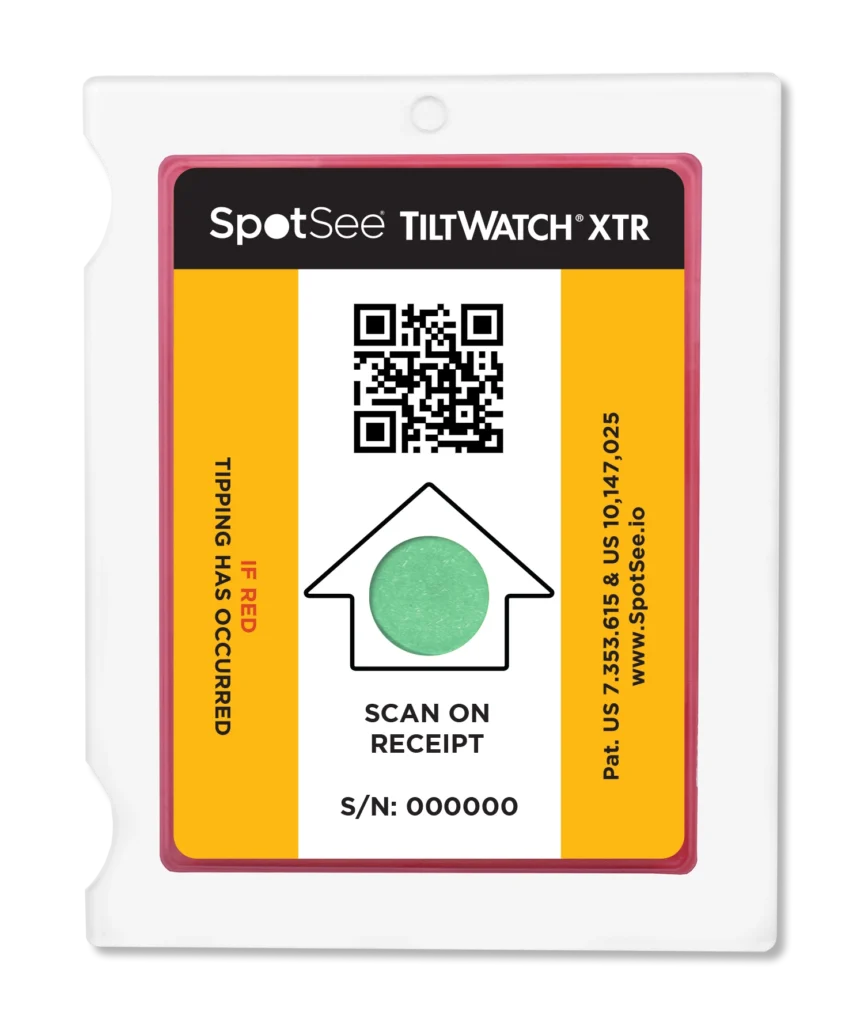
Think of shipment monitoring as a spectrum
The choice does not have to be “monitor the shipment” or “do not monitor the shipment.”
There is a spectrum of visibility.
At one end, a visual indicator can tell a receiver that a defined condition occurred.
QR-enabled indicators add a digital layer to that physical evidence. The shipment can be scanned at origin, receipt or other hand-offs, creating records tied to the individual indicator without requiring batteries, dedicated readers or an app.
Further along the spectrum, data loggers provide a detailed record of conditions over time. Connected monitoring solutions can add even greater visibility while the shipment is moving.
| What you need to know | Monitoring approach |
| Did a defined condition occur? | Visual condition indicator |
| Did it occur and can we create a digital record at a hand-off? | QR-enabled indicator |
| What conditions did the shipment experience over time? | Data logger |
| What is happening during transit and where? | Connected monitoring solution |
Each level answers a different operational question.The goal is not automatically to move as far down that table as possible. It is to select the level of visibility that supports the shipment’s risk profile and the decisions teams need to make.
When does a data logger make more sense?
There are shipments where a simple exception indication is not enough.
A data logger may be the more appropriate choice when QA or logistics teams need to analyze the complete condition history, understand duration and timing in greater detail or meet a regulatory or quality requirement that calls for recorded data throughout the journey.
That can be especially important for high-value, high-risk or highly regulated shipments where understanding an excursion requires more than knowing that it happened.
QR-enabled indicators are not a replacement for data loggers when continuous or interval-based monitoring is required. They are another level of condition monitoring for applications where immediate exception visibility and digital documentation provide the information the workflow actually needs.
The best shipment data is the data you can act on
More data can provide more context. It can also create more cost, infrastructure and information to manage.
The better question is whether that additional information changes what happens next.
If a shipment requires a complete journey history, use technology designed to provide one.
If the receiving team primarily needs to know whether a temperature, impact or tilt threshold was exceeded and create a digital record of what they observed, a QR-enabled indicator may provide the right level of visibility without the complexity of a traditional data logger.
Ultimately, effective condition monitoring is not about collecting the most data.
It is about collecting enough of the right data to make the right decision.
—-
You might also like


