

Not every temperature-sensitive shipment needs the same type of monitoring.
For some shipments, the most important question is simple: did the product experience a temperature outside its acceptable range?
For others, teams may need to know how long an excursion lasted, whether the product was exposed to freezing conditions, what happened throughout the entire journey or what is happening while the shipment is still in transit.
That is why choosing a temperature-monitoring solution should start with the information you need, not with the technology itself.
Start with the information you need
Different temperature-monitoring technologies are designed to answer different questions.
A visual indicator may be enough when a receiving team needs a clear signal that a specified condition occurred. A cumulative time-temperature indicator can provide more context when both temperature and duration matter. Data loggers create a detailed history while connected monitoring can provide visibility before a shipment even reaches its destination.
The goal is not necessarily to collect the greatest amount of data possible. It is to collect the right information to support the decision that needs to be made.
Before choosing a monitoring approach, consider questions such as:
- Do we only need to know whether a temperature threshold was crossed?
- Does the duration of exposure matter?
- Is the risk freezing, heat exposure, or both??
- Do we need a detailed temperature history?
- Do we need visibility while the shipment is still moving?
- What action will we take if an excursion is identified?
Those answers help determine which type of monitoring makes the most sense.
Irreversible and threshold temperature indicators
Irreversible temperature indicators provide visible evidence that specified temperature conditions have been reached.
Once activated, the indication does not reset. This can make them useful for receiving teams that need a straightforward way to determine whether a shipment may have experienced conditions outside an acceptable range.
Threshold indicators are particularly useful when the primary question is:
Did the product experience a temperature beyond a defined limit?
They generally provide a simpler answer than technologies designed to create a detailed record of conditions throughout transit.
For applications where this type of visible temperature indication is appropriate, Thermax can provide an irreversible indication that helps teams identify temperature exposure.
This approach can make sense when a clear visual result is more useful than a complete temperature history.
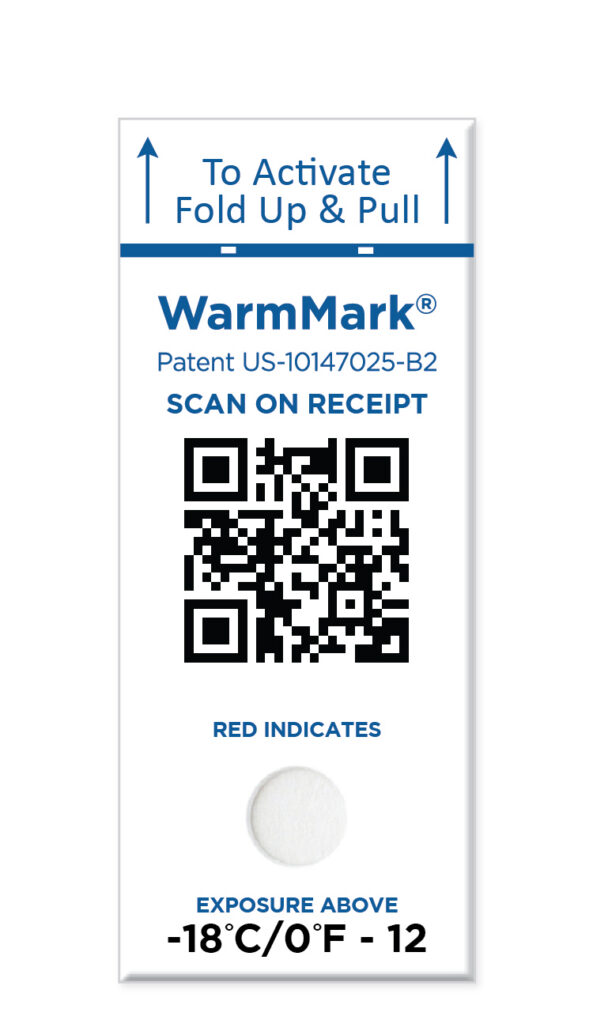
Cumulative time-temperature indicators: WarmMark QR
For some products, a single temperature event does not tell the whole story.
The amount of time a product spends above an acceptable temperature can also matter.
Cumulative time-temperature indicators are designed to account for exposure over time, helping teams understand whether a shipment has experienced a level of temperature exposure that may require further review.
WarmMark QR combines cumulative time-temperature indication with QR-enabled digital documentation.
Rather than simply showing that a temperature threshold was crossed at one moment, it is designed for situations where both temperature and duration of exposure are relevant.
The QR functionality also allows shipment condition information to be documented digitally at key points in the journey.
This can be useful when teams want a simple visual indication at receiving while also creating a digital record that supports traceability and follow-up.
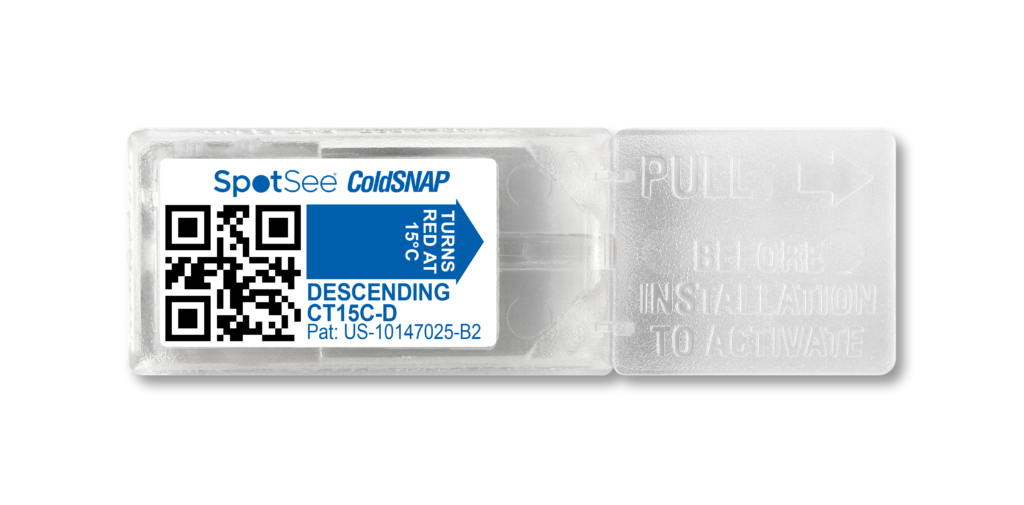
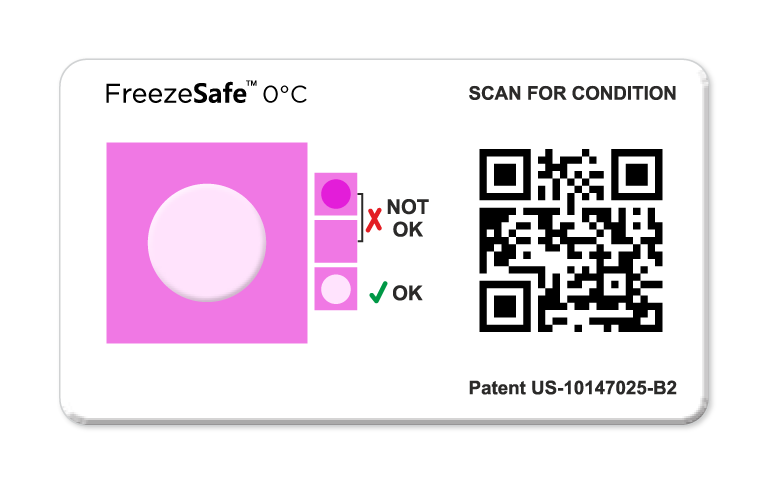
Freeze indicators: FreezeSafe QR and ColdSNAP
Temperature-sensitive products can be damaged by excessive cold as well as excessive heat.
That makes freeze monitoring a distinct part of the temperature-monitoring decision.
Freeze indicators are designed to help answer:
Was this product exposed to a temperature below its acceptable limit?
This can be especially important for products that may remain within their upper temperature range while still being compromised by freezing conditions.
FreezeSafe QR provides freeze indication together with QR-enabled digital documentation, helping teams identify and record potential freeze exposure.
ColdSNAP provides another option for applications where exposure to cold or freezing conditions is the primary concern.
The key distinction is that these solutions are selected around a specific risk: exposure below an acceptable temperature.
If freezing is the condition most likely to affect product quality or usability, a dedicated freeze indicator may provide the clearest answer.
Electronic data loggers
Indicators are designed to answer specific questions efficiently. Data loggers are useful when teams need a more complete picture.
Electronic data loggers record temperature measurements throughout a shipment, creating a time-stamped history of conditions.
That history can help teams understand:
- When an excursion occurred
- How long it lasted
- How temperature changed during transit
- Whether multiple excursions occurred
- What conditions the product experienced throughout the journey
This level of detail can be valuable when shipment risk, product value, quality requirements or investigation needs justify a more complete record.
It does not mean that every temperature-sensitive shipment needs a data logger.
If the primary decision is simply whether a defined condition occurred, an indicator may provide enough information with less complexity.
For a deeper comparison, read QR indicator vs. data logger: how much shipment data do you actually need?
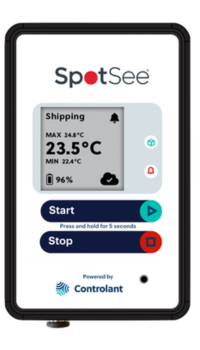
Connected and IoT monitoring: SpotSee Go
Sometimes knowing what happened after delivery is not enough.
For high-value, time-sensitive or operationally critical shipments, teams may need visibility while the shipment is still moving.
Connected monitoring can provide information about shipment conditions during transit, allowing teams to identify potential issues before arrival rather than waiting until receiving.
SpotSee Go can be introduced as part of this connected monitoring approach, providing visibility for shipments where real-time or near-real-time awareness can support faster decisions.
Connected monitoring can make sense when:
- The shipment is particularly valuable or sensitive
- An excursion may require intervention before delivery
- Delays or route changes could affect product condition
- Teams need greater visibility across a complex supply chain
- Waiting until receiving would be too late to take useful action
As with any monitoring technology, connectivity should be selected because it supports a specific operational need rather than simply because more data is available.
How do you choose the right type of temperature monitoring?
The easiest way to compare temperature-monitoring technologies is to start with the question you need the shipment to answer.
Do you only need to know whether a defined temperature limit was crossed?
A threshold or irreversible temperature indicator may provide the information you need.
Do both temperature and duration of exposure matter?
A cumulative time-temperature indicator such as WarmMark QR may be more appropriate.
Is freezing the primary risk?
A dedicated freeze indicator such as FreezeSafe QR or ColdSNAP can help identify exposure below an acceptable temperature.
Do you need a detailed record of conditions throughout transit?
An electronic data logger may be the better fit.
Do you need visibility before the shipment reaches its destination?
Connected monitoring such as SpotSee Go can support workflows where teams need access to shipment-condition information during transit.
The final decision should also consider factors such as product sensitivity, acceptable temperature range, shipment duration, shipment value, regulatory or quality requirements and what teams will actually do with the information collected.
Choose the information first, then the technology
Temperature-monitoring technologies do not all solve the same problem.
Some provide a simple indication that a threshold was crossed. Others account for cumulative exposure or freezing conditions. Data loggers create a detailed history while connected monitoring adds visibility during transit.
The right approach starts with understanding the decision that needs to be made.
Once that is clear, teams can choose a monitoring solution that provides enough information to support that decision without adding unnecessary complexity.
SpotSee’s upcoming ColdChain Product infographic will provide an additional way to compare temperature-monitoring technologies and identify which type of solution may be appropriate for different applications.
—-
You might also like
- Why cold chains don’t need more data. They need better evidence.
- Smarter temperature visibility: how WarmMark QR transforms cold chain tracking
- QR temperature indicators prevent unnecessary shipment returns


